Selected Projects
I list here some of the interesting recent and past projects I have worked on. Currently I am more interested in and learning about autonomous systems and computer vision.
ISAR: An Authoring System for Interactive Tabletops (2018-2019)
ISAR is an augmented Reality (AR) authoring system for interactive tabletops.
Authoring systems for AR try to compensate the complexity and challenge of development of AR applications by providing frameworks that can be reused. These frameworks are available at different levels of abstraction, from software libraries to high-level GUI solutions targeted towards end-users.
ISAR targets end-user development of AR applications for an interactive tabletop. By using ISAR, different domain experts, such as teachers or physiotherapist, who do not have any expertise in programming can created their own interactive applications.
ISAR consists of camera-projector based interactive tabletop and an authoring environment. The application author (e.g. a teacher) uses the authoring environment to creates an interactive application by defining scenes and interactions. A scene is a combination of virtual content and physical objects. The application is then projected on the tabletop and the application user interacts with it.
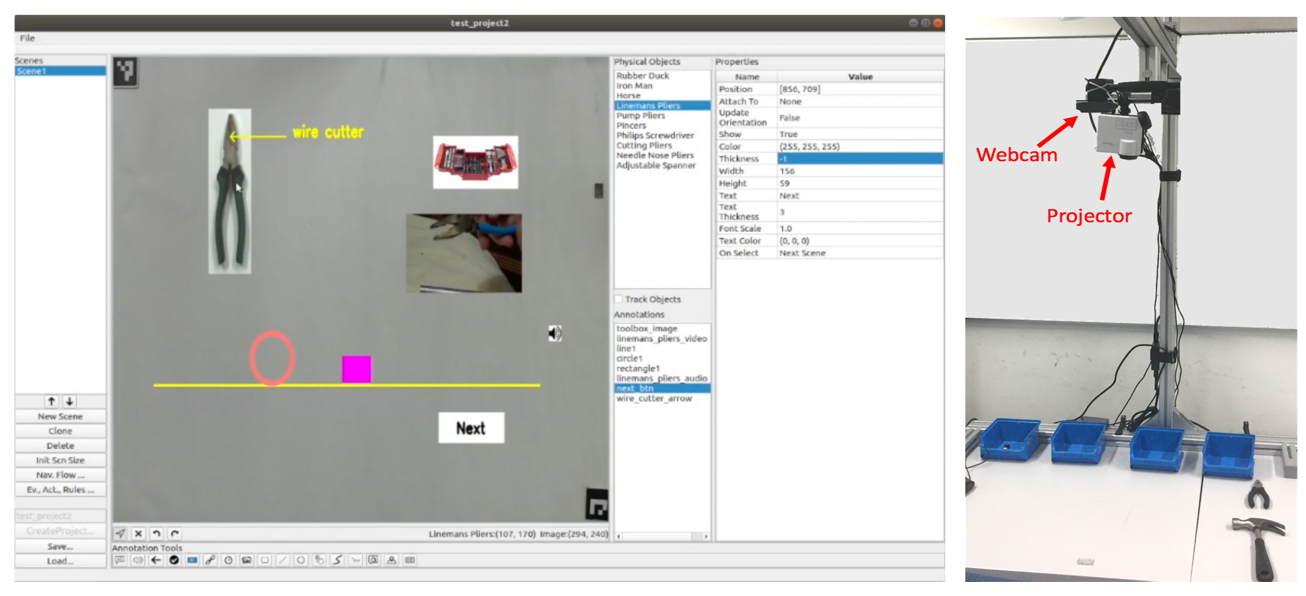
The application author creates an interactive application by defining the scenes and interaction rules. Each scene consists of different annotations, such as text, images, geometric shapes, videos and audio, etc., and physical objects. To design a scene the application author directly sees a camera feed of the table and can test his application directly from the authoring environment. The annotations can be attached to the scene, or attached to the physical objects. In the latter case their rendering is changed depending on the position and orientation of the physical objects.
Beside the scenes, the application author also defines interaction rules. Interaction rules define the response of the table upon different interactions of the user, the form of “If EVENT then ACTION”. For example, the application author can define a rule that plays a sound as soon as an object appears on the table. Several templates for interaction rules are available in ISAR, and the set of events and actions can also be extended by a programmer.
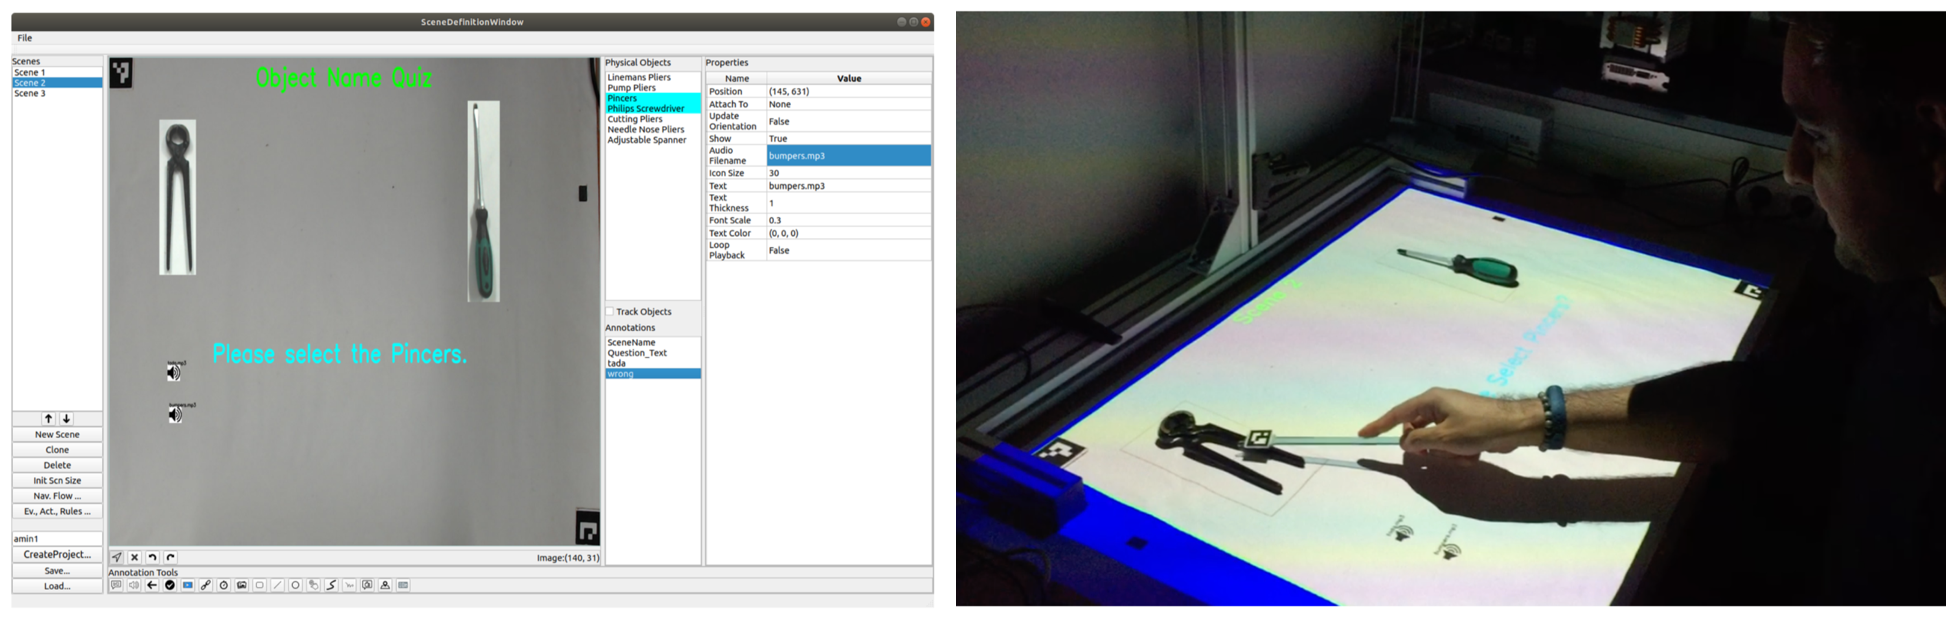
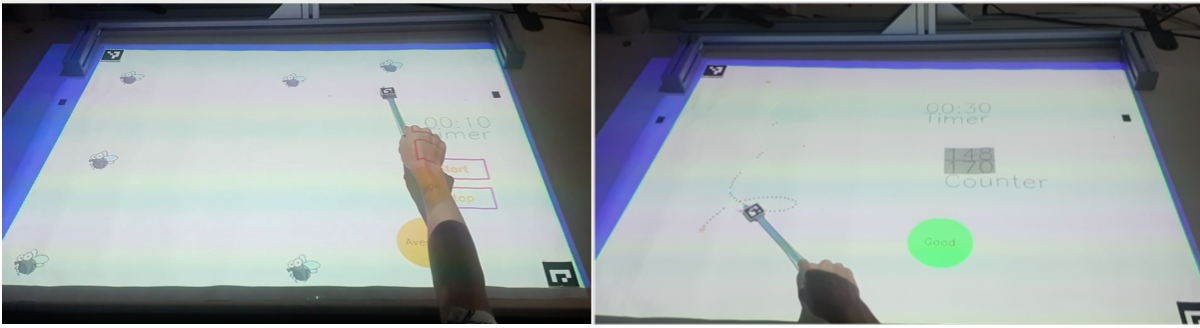
ISAR can be used to create interactive tabletop applications for different domains. In the following three applications are shown: An application for learning vocabulary; An application for guiding through a manual workflow; And two games for cognitive and upper body motor rehabilitation.
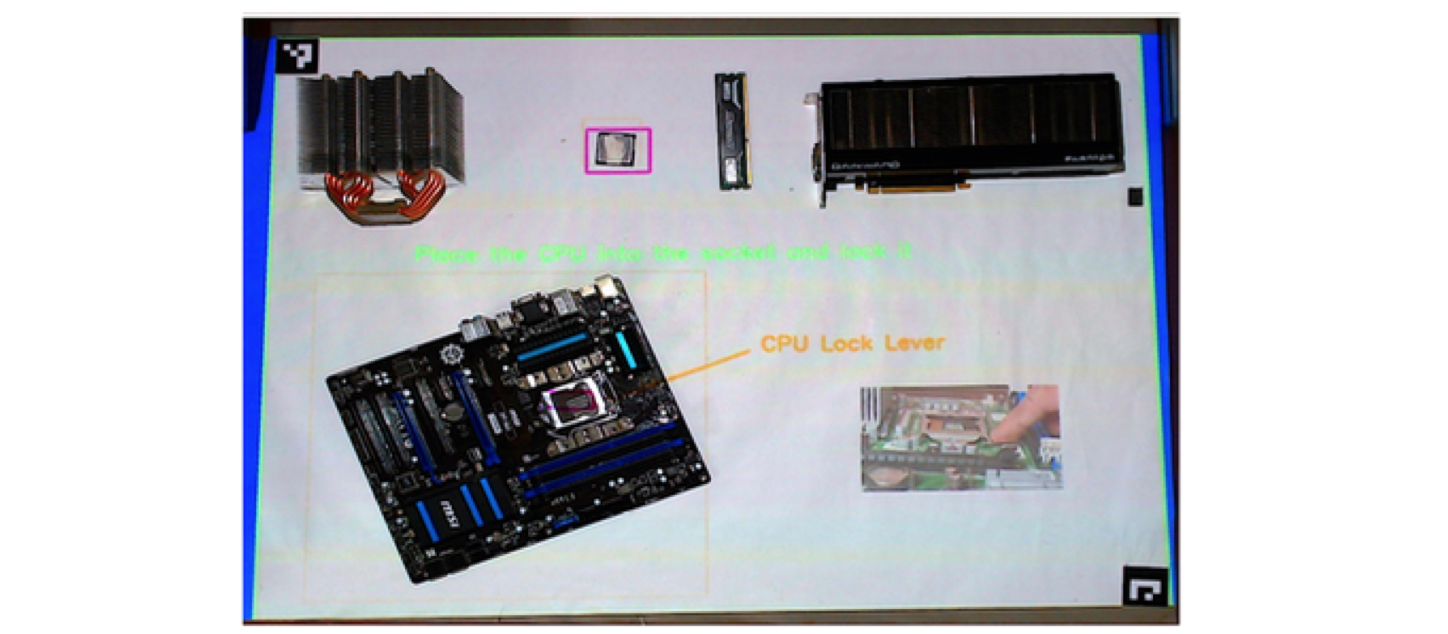
An interactive application was created using ISAR to guide the user through a workflow of assembling a computer mainboard. Scenes were created for each step of the workflow. Each scene consisted of hints and guidance on how to perform the step, such as arrows that show where to place a part. Interaction rules defined the transition between scenes and if a part was missing or the wrong part was picked.
ISAR can be used to create interactive applications that support medical rehabilitation, for example post stroke rehabilitation. The application consists of two games. In the first game, the user (e.g. a post stroke patient) should hit moving flies on the table. In the second application the user should follow a projected path on the table and gest scores on how well he could follow the path. In both cases interaction rules are defined for calculating feedback that is shown using a feedback annotation.
The source code of ISAR can be found here and here is a short video demonstrating the system.
2D Object Tracking (2018)
As part of ISAR, I wrote code for tracking of the objects put on the tabletop. The tracking code uses Yolo V2 for object detection. Pose estimation is done using feature matching (AKAZE features) and OpenCV’s estimateAffineTransform. Pose refinement is done through image alignment using Enhanced Correlation Coefficient (ECC).
Here is the link to project source code.
Lane detection using OpenCV (2020)
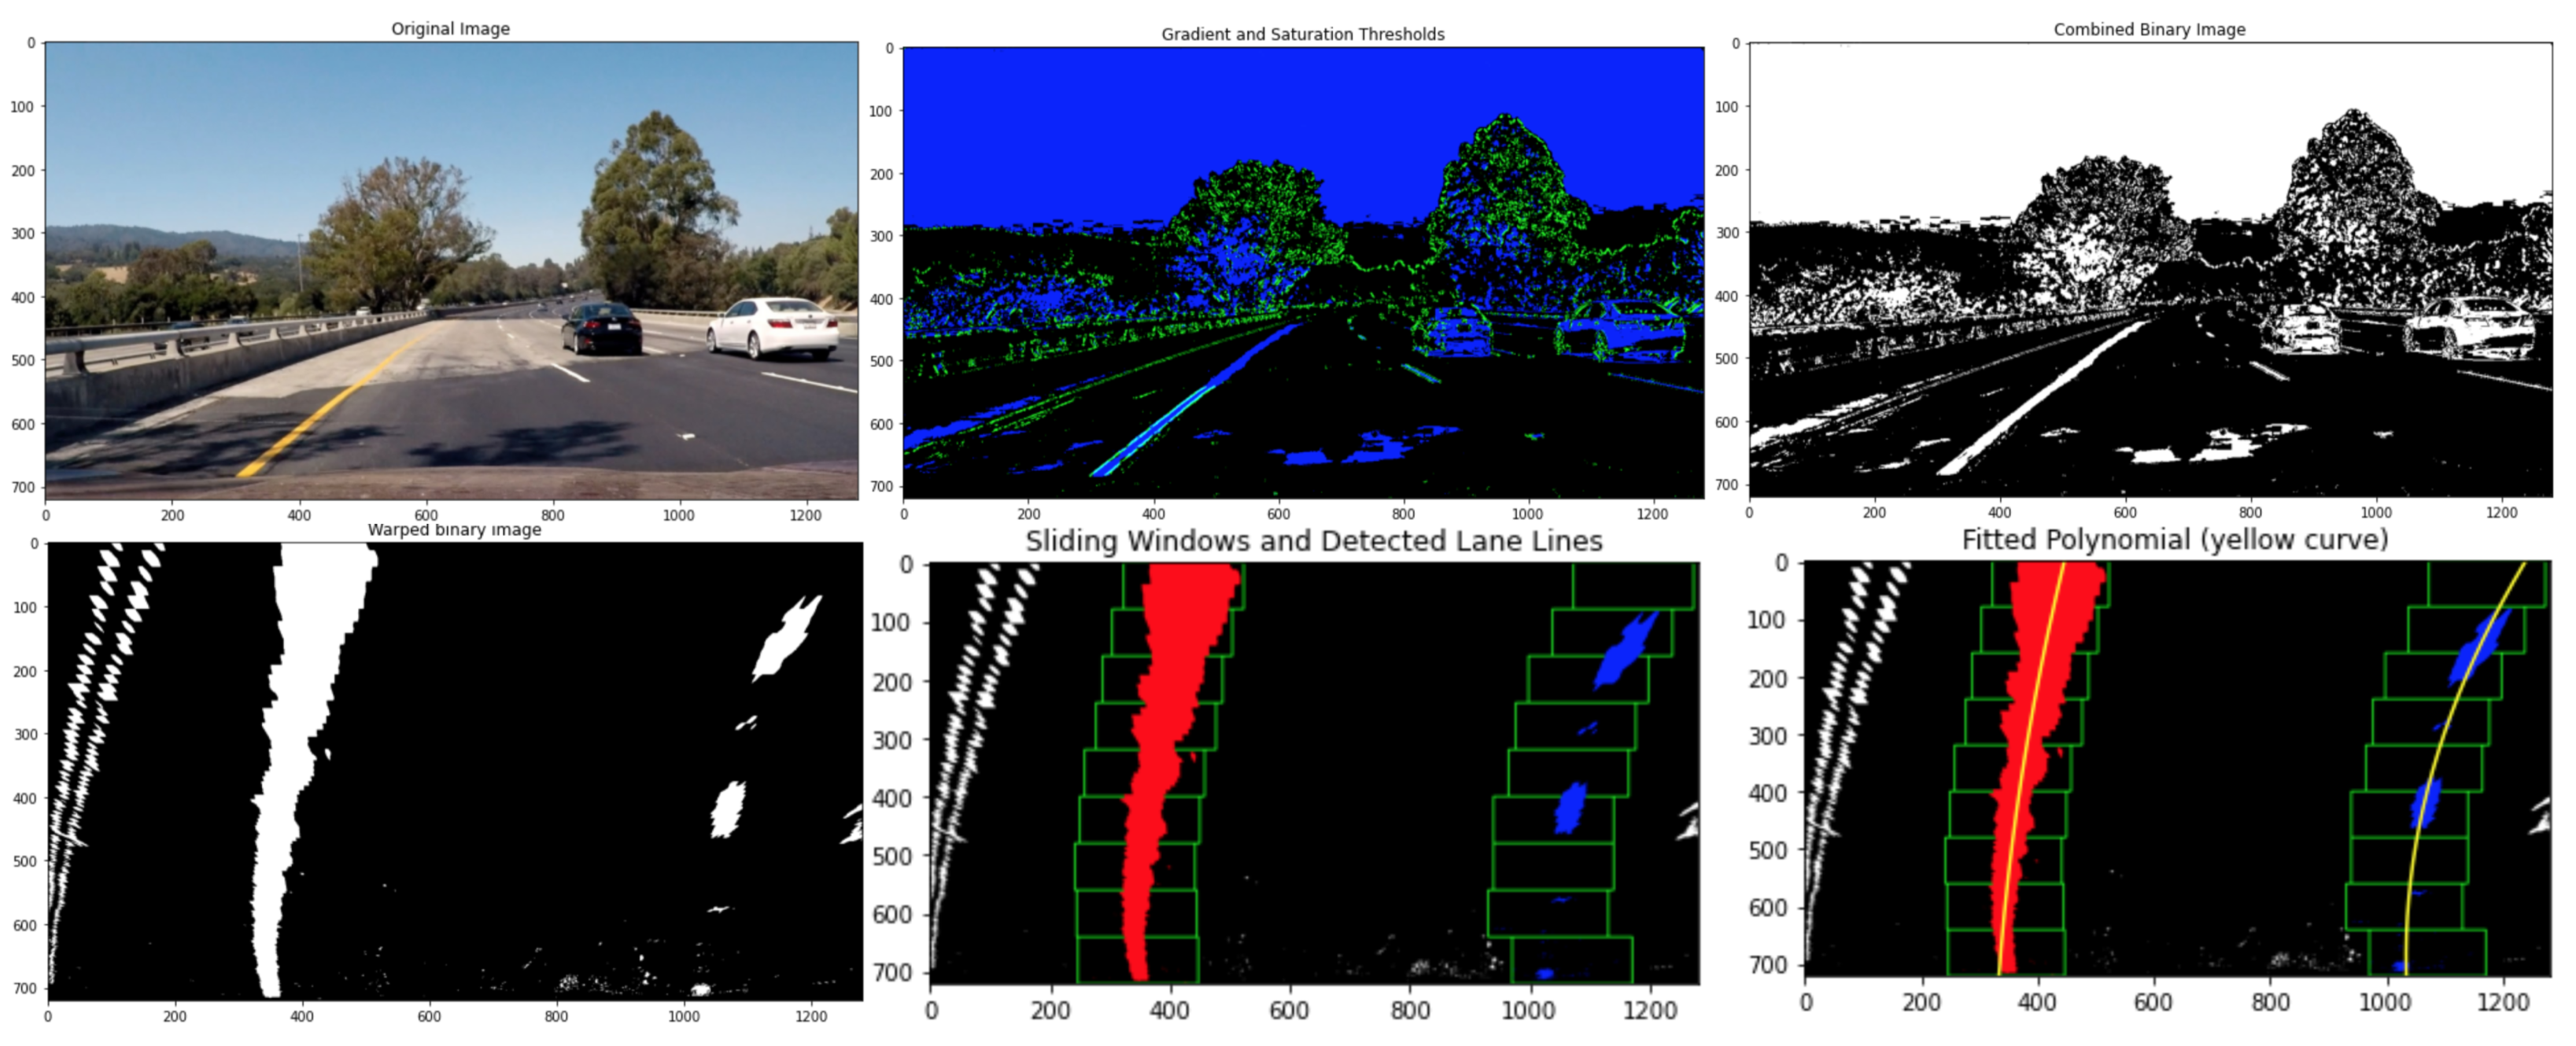
Detecting the lane lines under challenging real conditions, including lane curvatures, change of lighting and lane colors, shadows, and different road conditions. For each frame in the input video the steps of a pipeline is are applied including image processing, detection of the lanes, and estimation of lane curvature. The result of the pipeline is overlaid back on the original image.
For each frame in the input video the steps of a pipeline is are applied including image processing, detection of the lanes, and estimation of lane curvature. The result of the pipeline is overlaid back on the original image.
Steps:
- Camera calibration
- Distortion correction
- Gradient and color thresholding
- Perspective transform to rectify the image
- Detecting lane pixels and fitting a polynomial
- Determining lane curvature and vehicle offset
- Warping detected lane boundaries back to the original image
- Visualizing lane boundaries and outputting lane curvature and vehicle offset
Source code of the project can be found here.
Traffic Sign Classification (2020)
In this project, a convolutional neural networks is used to classify traffic signs. The model is trained and validated on German Traffic Sign Dataset.
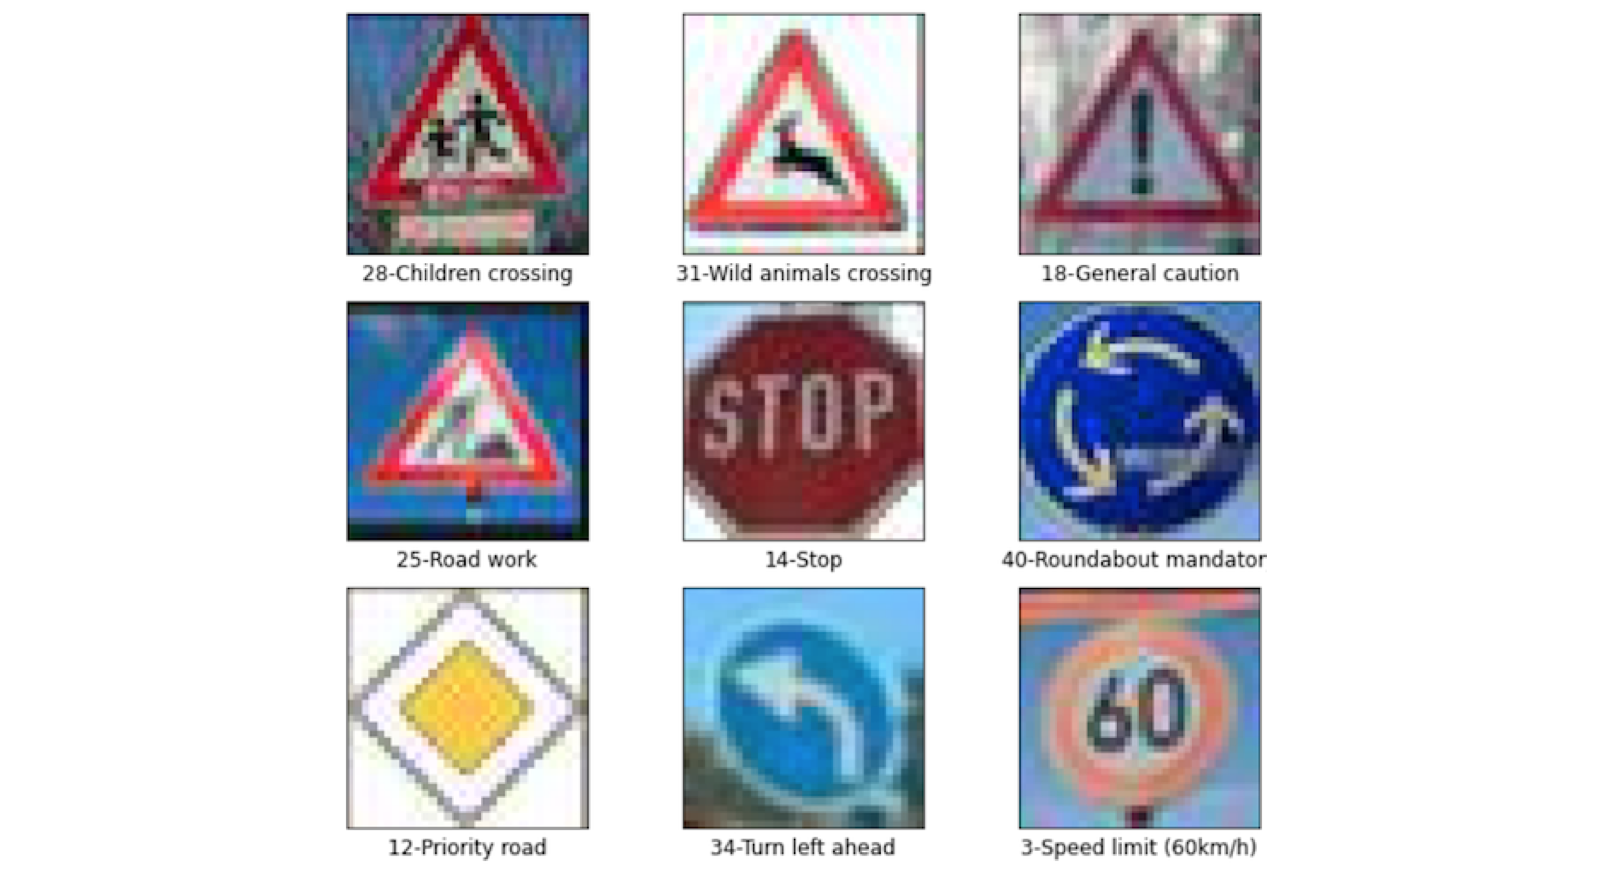
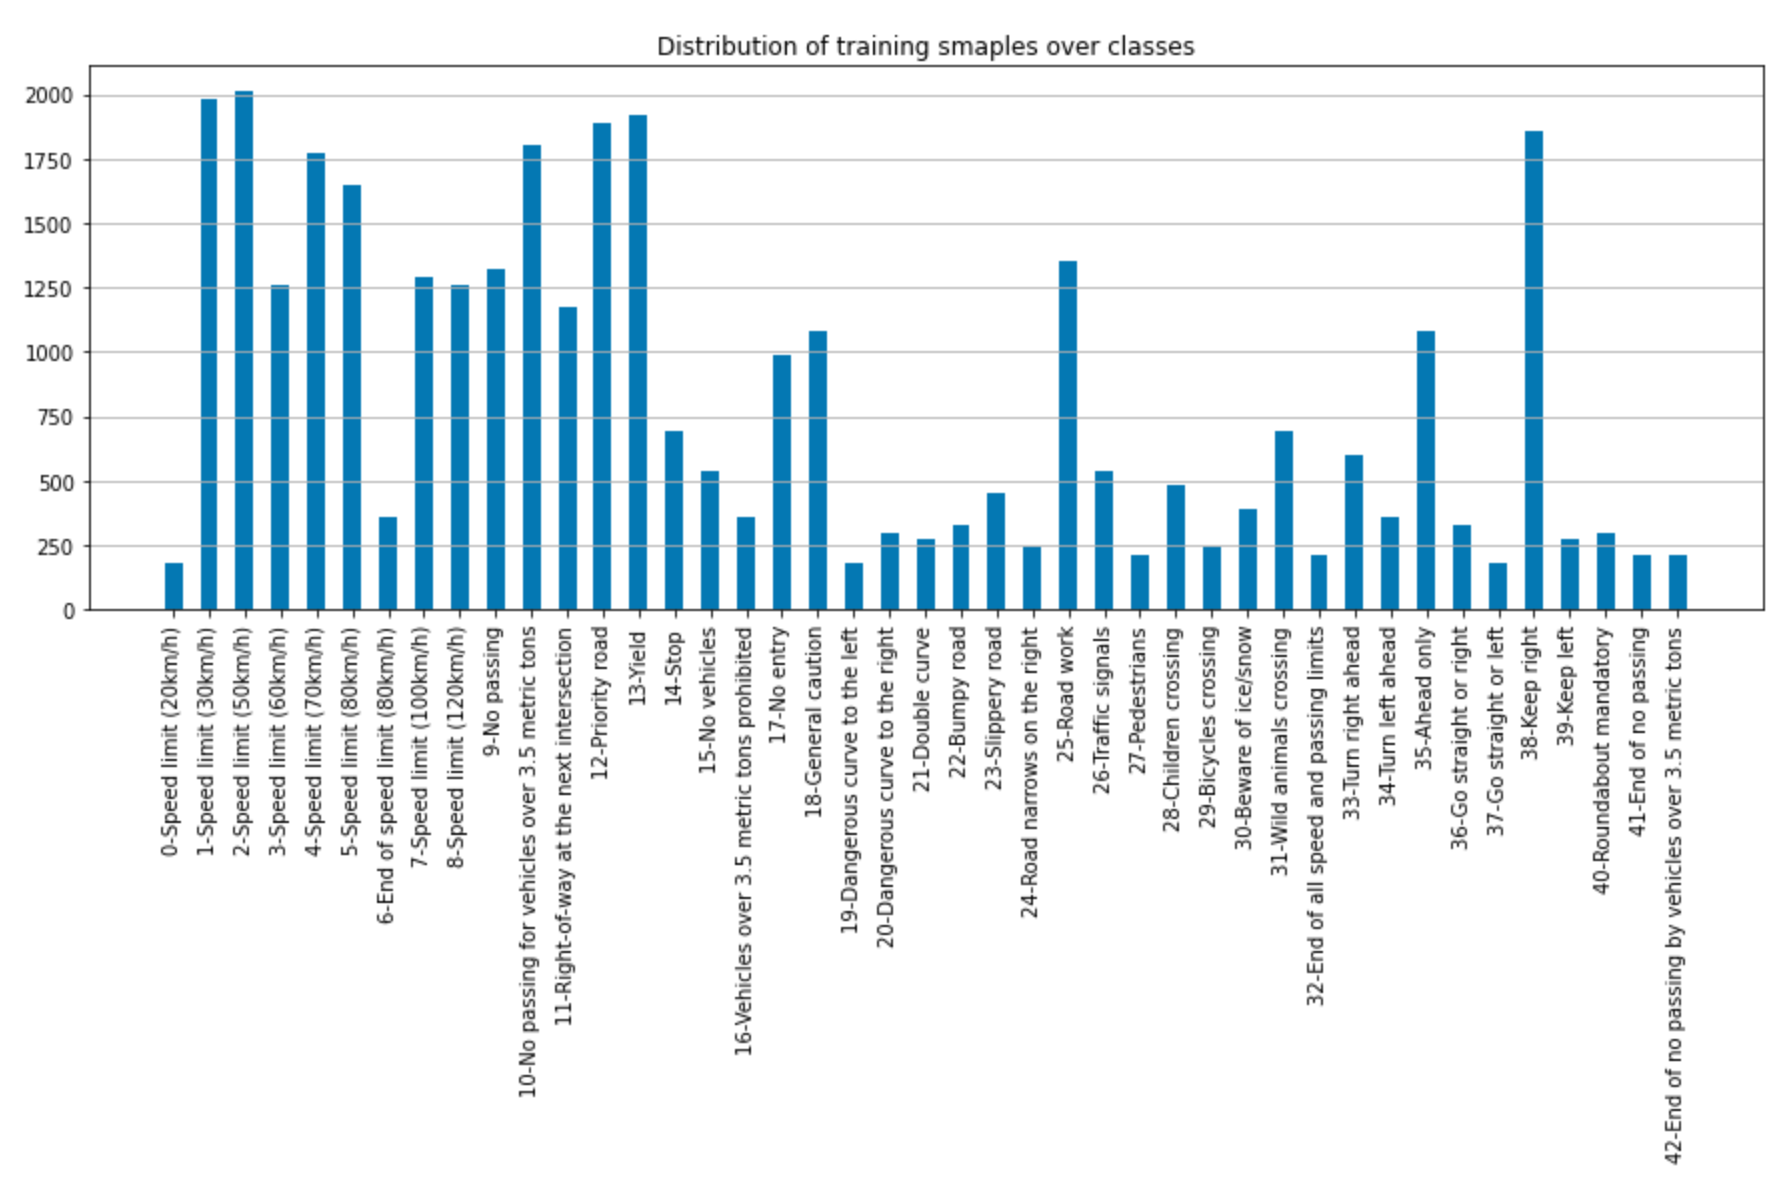
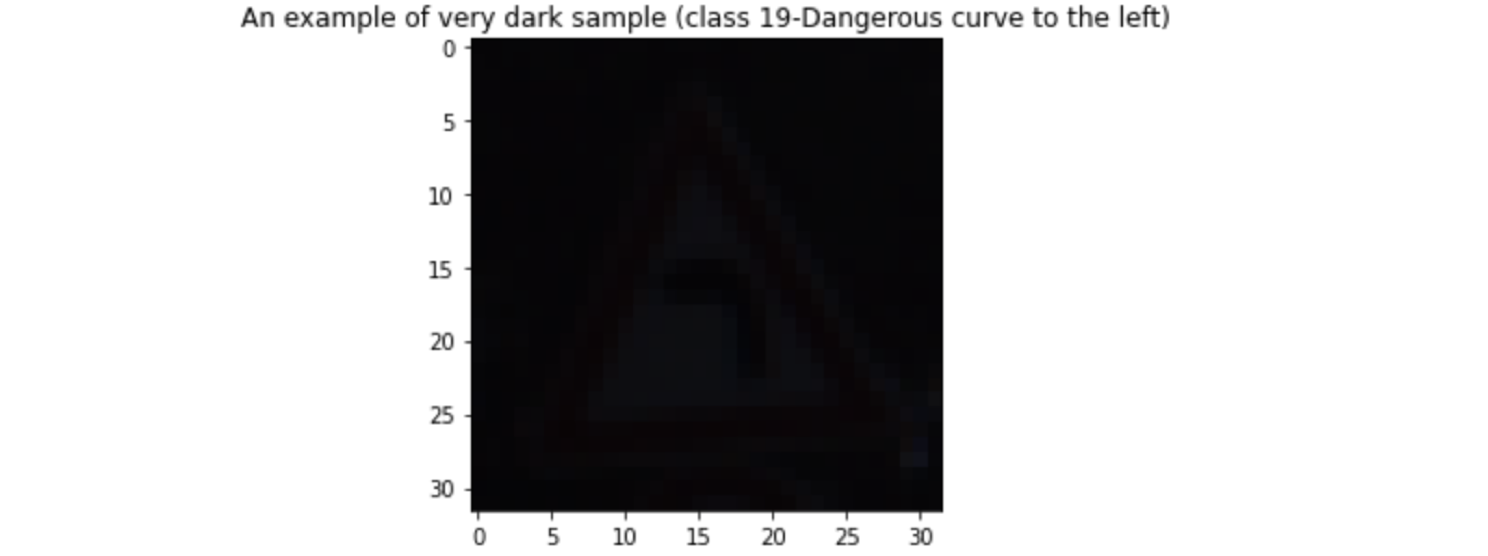
The dataset consists of more that 51k images for 43 classes of German traffic signs (34799 training, 4410 validation, 12630 test). The images are cropped 32x32 RGB images of the traffic sign. The distribution of the training data is not uniform. With as few as about 180 images for classes like “0-Speed Limit (20 km/h)” or “19-Dangerous curve to the left”, to around 2000 or more for classes like “3-Speed Limit (50 km/h)” or ““2-Speed Limit (30 km/h).
Also the quality of sample images differs a lot. Some images have very good lighting, are clear and sharp, and occlusion free. Some samples are very dark, are partially occluded, have noise (like stickers attached on the sign). The following figure is an example of a very dark sample, that is practically unrecognizable for human eye:
I adapted LeNet for RGB images and number of classes in the traffic sign database. The model achieved good results for project requirements (96% accuracy on test set; project requirement was at least 93% accuracy on test set).
The source code of the project can be found here
Tracking and Localization (2020)
In the first part of this project I used an Extended Kalman Filter to sensor fusion to estimate the 2D position and velocity of a vehicle from Radar and Lidar data. The image below shows an example:
In the image above, the green triangles show the estimated state, the red circles are Lidar measurements (x, y) and the blue circles show Radar measurements (range, bearing, and range rate); an arrow (inside blue circle) points in the direction of the observed bearing.
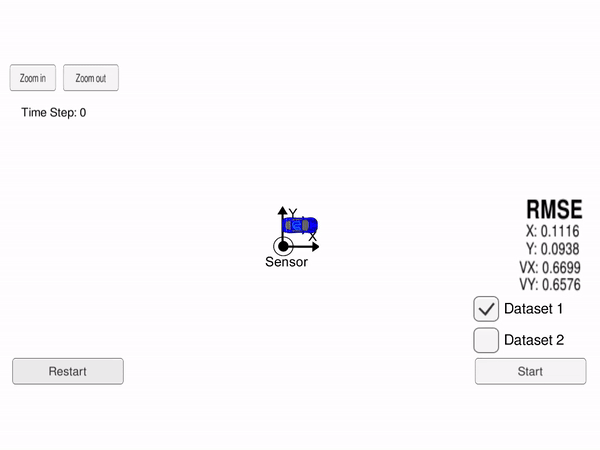
Our goal is to do sensor fusion using Kalman Filter (for Lidar measurement) and Extended Kalman Filter (for Radar measurement) to estimate the state (position and velocity), with RMSE less that a given upper bound and as low as possible.
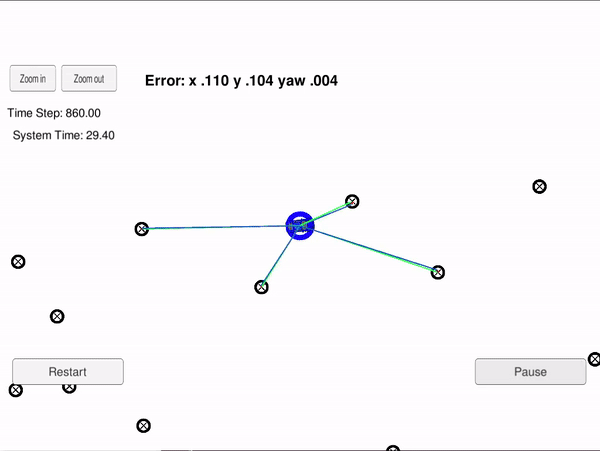
The second part of the project is the C++ implementation of a 2D particle filter localization. The image below shows the results tested in the simulator. The blue circle shows the estimated position of the car. The green lines show the ground trough measurement of the landmark measurements near the car. The blue lines show the predicted landmark measurement.
A particle filter consists of a set of estimates of the system state (the particles) that are refined in a series of iterations. The particles are initialized using an initial rough estimate of the system state (for example a GPS localization in case of a self-driving car). In the light of sensor measurements, at each iteration, the particles that are most likely to have a correct estimated of the system state are chosen for the next generation. This process hopefully converges to a point that the set of all particles represent an accurate estimate of the posterior state of system. The idea of particle filters is very reminiscent of population-based meta-heuristics, such as evolutionary algorithms.
To estimate the state of the system using noisy motion model and noisy senors observations, a particle filter continuously iterates the following steps:
- Prediction: predict the state of the system using previous state and the motion model
- Measurement Update: in light of the sensor measurements, assign each particle a weight that corresponds to its likelihood of representing a good estimate of the system state (an estimate that is in good adherence to the observation)
- Re-sample: select the particles for the next generation. The probability for a particle to be selected is proportional to its weight
The source code of sensor fusion project can be found here and the source code of particle filter localization is here.
Path Planning for Autonomous Driving (2020)
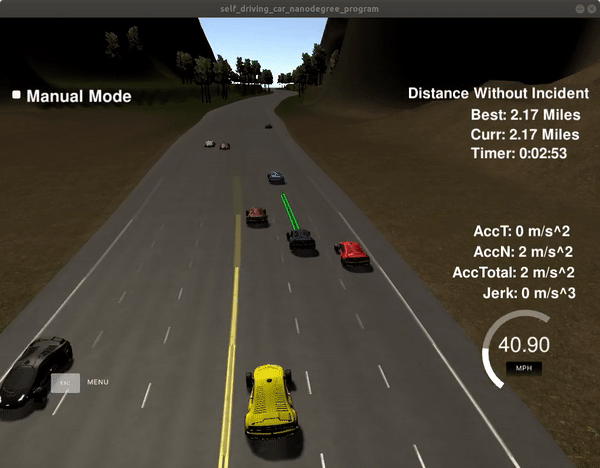
This project was about development of a Path Planning and Trajectory Generation component for an autonomous vehicle driving in a highway.
The vehicle drives in a simulator and the vehicle and environment data, including localization and tracking data of other vehicles are sent over a WebSocket to the path planning process. The goal is to drive the car safely around the simulator track with the highest possible speed, without any collision, and without exceeding maximum allowed total acceleration and jerk.
The Path Planning component has the following main modules:
- Map: Contains a sparse map list of waypoints around the highway as well as some helper methods for converting coordinate and angle values.
- Prediction: Takes the sensor fusion data from simulator and generates predictions about state of the road such as lane distance to front cars and lane blocked state.
- Behavior Planning: Given the predictions, the Behavior Planner finds a best behavior by calculating a combined cost function for each possible behavior, and returning the behavior with the lowest cost. A behavior defines if the car should keep or change the lane and the target velocity for the AV. The cost function is a combination of various costs for example for speed, distance to the front car, lane change, etc.
- Trajectory Generation: Generates a trajectory for the best behavior respecting the collision, speed, acceleration, and jerk constraints.
The source code of the project can be found here.
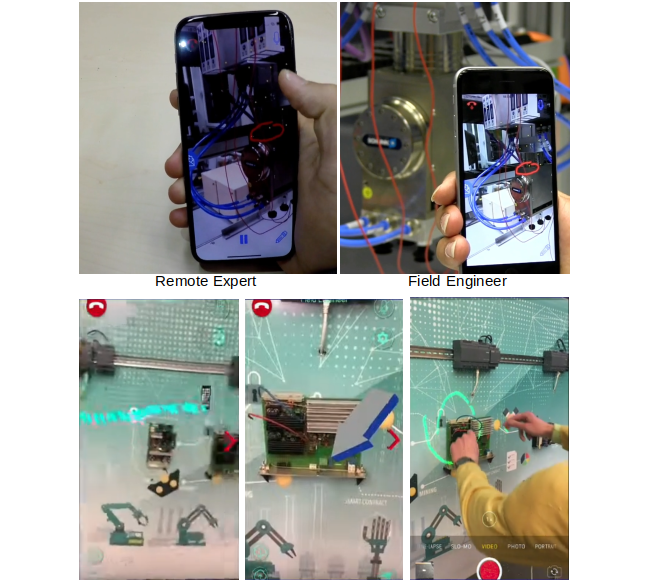
ViewGuide (2018)
ViewGuide is a mobile Augmented Reality app that aims to improve realtime communication between field engineers and remote experts. The remote expert sees in realtime what the field engineer sees by sharing the video stream of the field engineer device. He can then use different annotations such as arrows and free drawing to guide the field engineer. The annotations drawing by remote expert are registered on the camera view of the field engineer. We did this project for one of our industrial partners and I was the technical lead of a team of 9 students.
ViewGuide is built using Apple’s ARkit framework and WebRTC was used for handling the peer to peer audio and video connection between users. Supported features include:
- Remote AR annotations: remote expert can add annotations on his device on top of the shared camera stream. That annotations are then registered to the camera view of the field engineer.
- Remote pose guidance: remote expert can use his device to guide the field engineer to a specific camera pose. The relative movements of the expert’s device are tracked using its motion sensors. These movements are then transformed and registered in 3D on the camera view of the field engineer. In this way the remote expert can guide the field engineer to move his device to reach a specific perspective (camera pose).
- Offline statistics about annotations: information about each remote support session are recorded and aggregate information about annotation positions are represented as a heatmap registered on the target scene. This feature is useful for understanding, analysis, and improvement of the design of industrial devices.
- New interaction approaches: remote expert can use Apple Pencil to change position and orientation of a virtual 3D arrow that is registered on the camera stream of field engineer in realtime. To enhance the remote communication, the gaze of remote expert is captured on his device and registered using a gaze icon on field engineer’s camera stream. In this way the field engineer is aware of what remote expert is looking at as they communicate. In another scenario we used a body-worn projector to project the augmentations on the workspace of field engineer.
- 3D reconstruction of the environment: A 3D model of the environment is asynchronously generated on a server from images of the camera stream of the field engineer. The remote expert can see, investigate, and refer to this 3D model for better guidance.
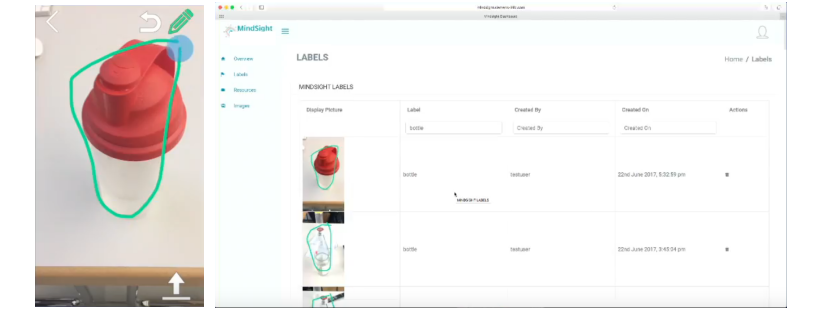
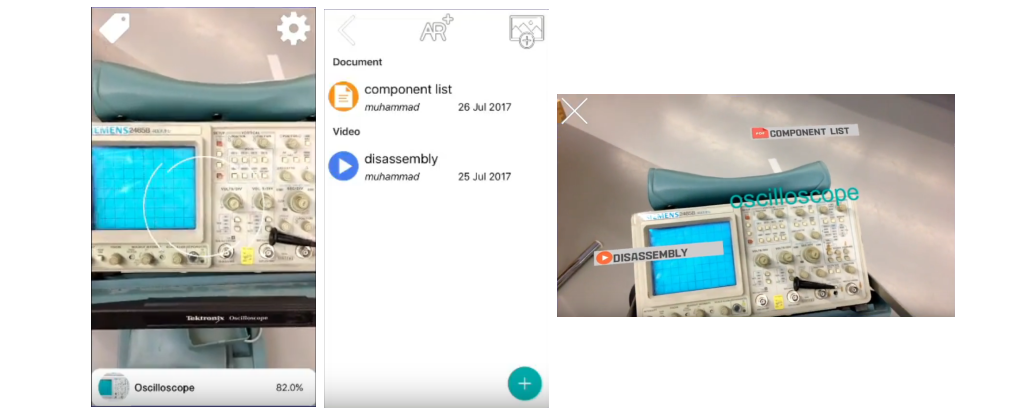
MindSight (2017)
MindSight is three apps in one: crowd-sourced information aggregation and image labeling, image-based information retrieval, and augmented reality documentation.
Object recognition is an important part of every augmented reality application. Several databases exist to train object recognition models on everyday objects. However in order to train a model to recognize industrial objects and tools related to a large company, we need to create our own dataset that can be cumbersome and incomplete. MindSight provides a solution to this problem through crowd-sourced information aggregation and image labeling. Workers and employees of a large company can take photos of the industrial objects, label them, and upload them to a central database. Object Recognition models are then periodically trained on the newly arrived labeled images. Image datasets and the uploaded information can be further managed through a web application.
The trained models can then be used for information aggregation and image-based information retrieval. As soon as the models recognize and object, the employees can upload information, such as documentation, comments, images, etc. for those objects. The object recognition can also be used to retrieve the crowd-uploaded information. The information can further be filtered based on context, such as GPS location of an object instance.
The retrieved information can then be accessed through ordinary mobile app UI, or projected right onto the object view through augmented reality.
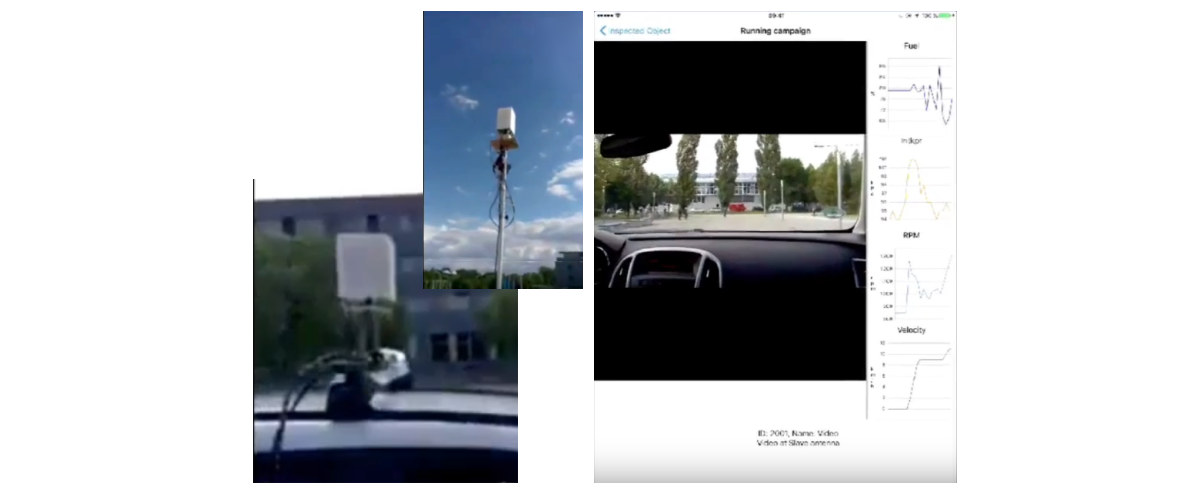
iPaula (2016)
In iPaula we developed a mobile UI for a specific phase shift antenna. The antenna was developed by our industrial partner. The system consists of a pair of phase shift antennas that can provide high band-width over a long distance. The antennas must be in line of sight of each other and must be paired before communication can start.
I was the technical team lead of a team of 6 students. We developed a mobile app to control and pair the antennas and demonstrated two possible application scenarios. The mobile app communicated with antenna hardware via a custom protocol over Telnet. In the first demo application scenario we showed how large amount of information retrieved from remote field sensors can be collected by the antenna and presented on the app UI. We used a scenario for maintenance and repair of wind turbines for it. In the second scenario we showed how the antenna and the mobile app can be used to transmit HD video from a moving vehicle along with the sensor readings related to the car.
iPaula was one of the challenging and very interesting projects I did. The challenge in project was the custom hardware that we received late in the project. We had to code our app by mocking and simulating the hardware before we received it. Another challenge was in the very complex hardware setup we had to use for our demonstrators, consisting of both antennas and the networking setup.
MagicTouch (2016)
MagicTouch was a project to investigate the use of off-the-shelf and custom-made wearable technologies to improve workflows and productivity in an industrial setting.
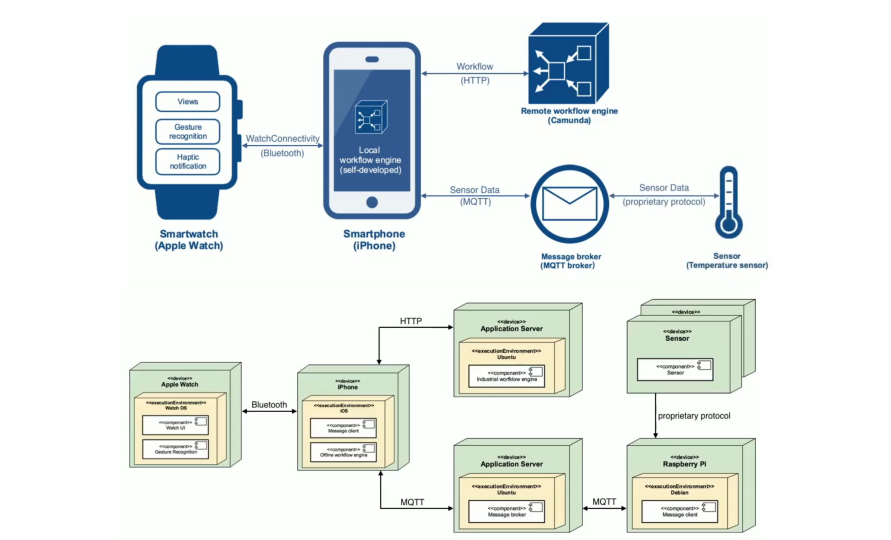
Several features were investigated and implemented in this project that support a manual industrial workflow, including:
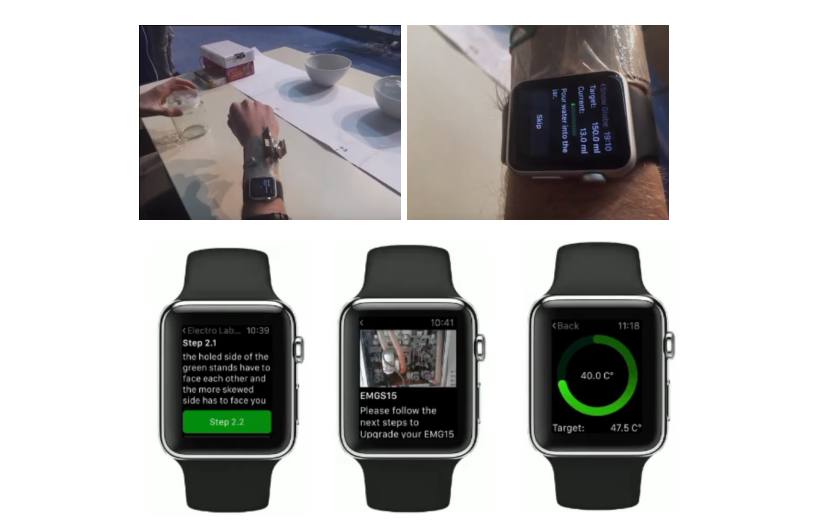
- Workflow guidance: The steps of a workflow were presented to the worker using a smart watch. This included text descriptions, images, and audio guidance. Different possibilities were also investigated for context-aware navigation through the steps of the workflow. For example picking of a part or special gesture patterns.
- Integration with environment sensors: Information collected from environment sensors were mediated by the middleware and displayed on the smart watch. For example in one scenario we showed values of a temperature sensor on the watch and triggered haptic feedback as soon as a target value was reached. In another scenario a distance sensor measured the position of worker’s hand and as soon as the hand was at the right position a haptic feedback was triggered on the smart watch.
- New interaction modalities: Gesture detection using motion sensors on the watch were used to control navigation through the workflow. Haptic feedback of the watch were used to signal critical values and other important context information to the worker, e.g. when worker’s hand is on top of the right box in a pick and place scenario. In another scenario where the worker needed to pour a liquid from a bottle into a container, gesture recognition was used to give the worker haptic notification when target value was reached.
- Custom-made wearable and coordinated interaction using two wearable devices: In a pick and place scenario, a custom-made wearable RFID detector was used to detect positioning of the hand on top of a target box, which in turn triggered haptic feedback on the smart watch worn on the other wrist. This scenario can be useful for example for workers with visual impairment.
BSB Navigator (2015)
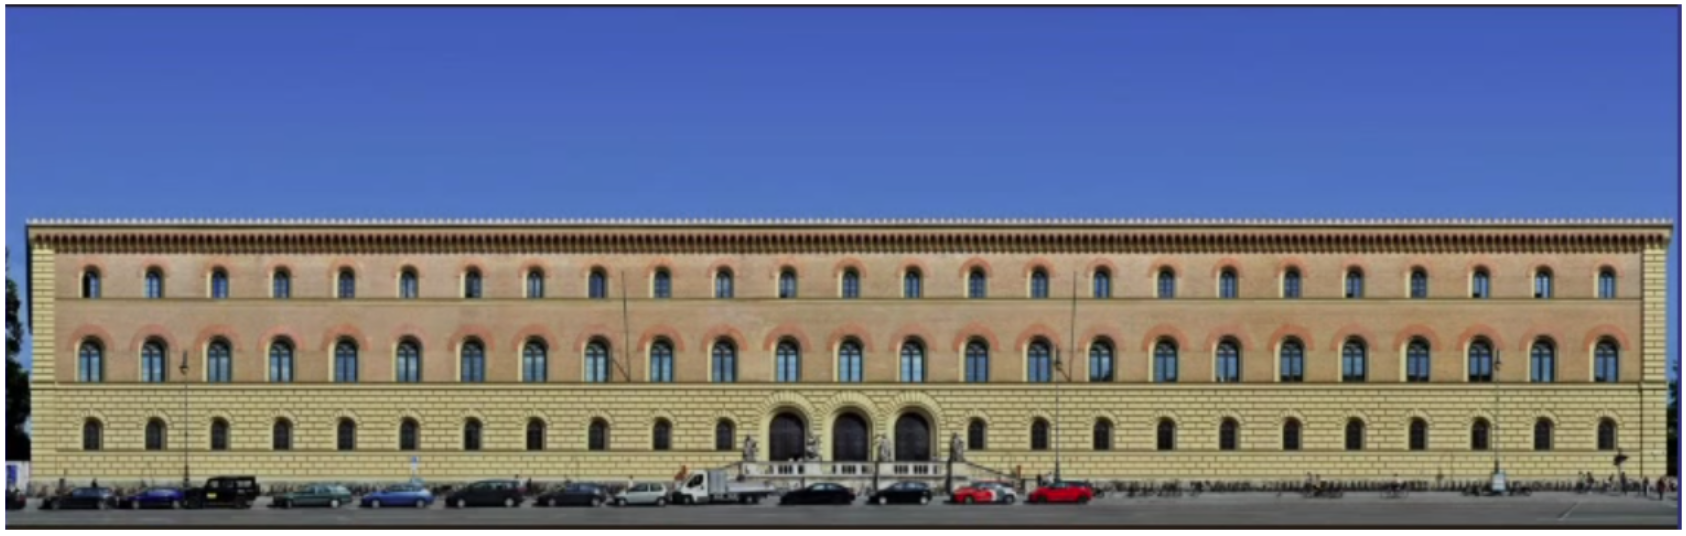
In this project we developed an indoor navigation system based on Bluetooth Low Energy (BLE) beacons for Bavarian State Library (BSB). Bavarian State Library is one of the largest libraries in Germany with more that 3000 visitors per day and an area of more that 30,000 square meters on 5 floors. The library offers different facilities including books, magazine, and historical recordings.
I was the technical lead of a team of 7 students. We cooperated with an industrial partner that delivered UI design of the app. All other steps of the project, including research on the beacons, BLE-based indoor navigation library, installation of beacons, fingerprinting and mapping of the building, and development of the app was done by my team in a timeline of only 4 months (Note also that the team could work full time on the project, because the students had other lectures and I had other projects too).
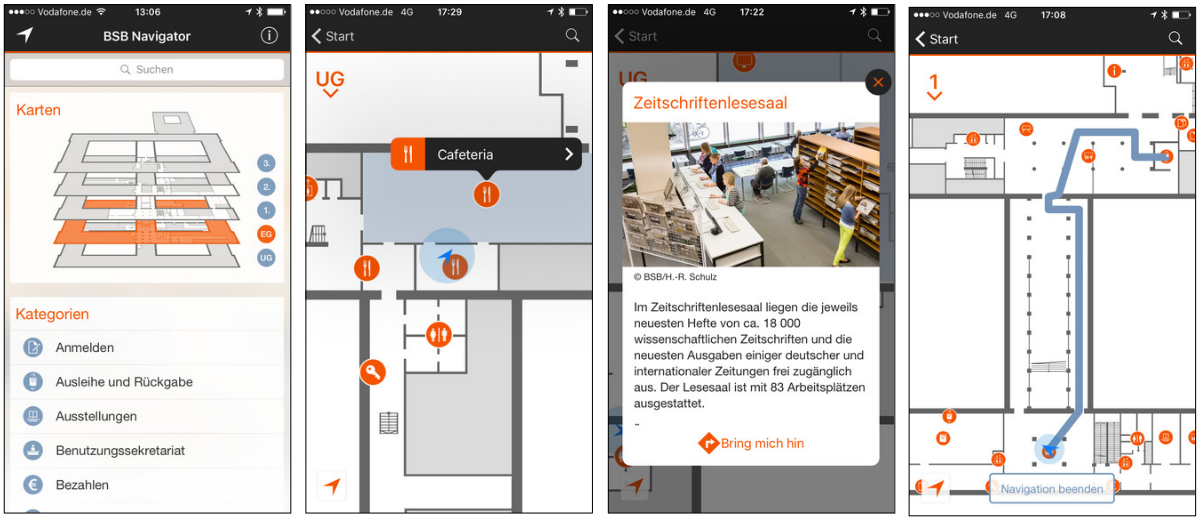
This was one of the most challenging and interesting projects I did. On the one hand, the library building was part of the software. We had to do most of our development and testing activities inside the building. On the other hand, indoor navigation based on BLE beacons was not mature yet at the time. We had to research and find appropriate BLE beacons types, considering a long list of requirements such as accuracy and battery life. Another big challenge was installation of more than 250 BLE beacons and fingerprinting of the signal across all navigable area for localization. Despite all challenges, this project was very successful and the app was published by BSB and went to production use.